Friday, December 31, 2021

Alternate Appliance Troubleshooting


Normally I would not document about an appliance problem.  After all I have replaced quite a few components across a wide array of appliances including a stop clutch in a Whirlpool washing machine.  However this latest experience was one that I felt needed better documentation given that the symptoms can sometimes be confused with those of other components and one might replace those first which can lead to a lot of extra cost without results.  Before we dive into the symptoms and fix though, lets introduce the appliance in question.  In my case it was a Whirlpool Gold Series Dishwasher (WDF750SAYM3) however the following will most likely apply to any Whirlpool dishwasher.

The problem started a few months ago with a undissolved soap packet after a completed cycle.  I didn't think much of it and carried on.  However then on another cycle I never heard the water spraying inside the dishwasher.   The washer would fill and drain but never engage the spraying of the water to actually wash the dishes.   At this point I was starting to wonder what was going on so I did a little research and found how to do a diagnostic run cycle on the dishwasher.  This involved by pressing any 3 (three) keys in the 1-2-3-1-2-3-1-2-3 sequence except Start, Delay,  or Cancel  and making sure the delay between key presses is not more than 1 sec.  If a problem is found, the dishwasher may display an error code by flashing the clean button in two sequences.  The first sequence will flash the clean led multiple times and then pause and the second sequence will flash clean led multiple times.  By counting the flashes in both sequences I would get a two digit error code.  However upon running the diagnostics I only got a code showing the water was too cold which makes sense because the run from my hot water heater is quite far and unless I run the hot water at the sink the initial water will be cool. With the diagnostics not showing any issues I started to try to find an answer online.  Most of the information found though seemed to point to a bad spray pump or a controller board issue.   I did not think it was either of these those because on some days the dishwasher worked normally without any problems but then on other days it seemed more problematic.  That was when I stumbled across a post where it was indicated that on this particular model of Whirlpool dishwasher there was a bad latch design and the latch mechanism had no test in diagnostic mode.  I thought I might be onto something so I replaced the latch with a new redesigned part.  The dishwasher seemed to be working.

The success however was short lived and if anything I was seeing the pattern of failures starting to become more prevalent.  In observing the dishwasher I found that a run would fail if during the first fill the spraying action did not start before the water shutoff.  So I would hit Cancel and Start again and sometimes it would eventually work.   I also found that if the water was hot on the start the chances of a successful wash went up.  Again when the dishwasher would work it was just fine so I still was ruling out it was a spray pump issue or controller board issue.  If either were truly bad I would expect my dishes to come out dirty and when the dishwasher worked they were clean.

Again I went back to researching on the internet and came across a conversation about the turbidity sensor (sometimes referred to as OWI) in Whirlpool dishwashers.  So what does this sensor do?  As the soil level increases, the amount of transmitted light decreases. The turbidity sensor measures the amount of transmitted light to determine the turbidity of the wash water. These turbidity measurements are supplied to the dishwasher controller board, which makes decisions on how long to wash in all the cycles.  However this is only part of the story because this sensor also has a thermistor built into it as well which monitors water temperature.  The temperature monitoring is key because as I stated earlier my dishwasher seemed to have better success when the water was very hot coming into the dishwasher.

With my new found information I proceeded to test my turbidity sensor.  With the power supply to the dishwasher turned off, the turbidity sensor can be tested from the main controller board at the connection P12 from the wire at pin 1 to the wire at pin 3. The resistance should measure between 46KO to 52KO at room temperature.  My resistance however was not in specification so I knew I found the source of my problem.

I went ahead and ordered my replacement sensor and when it arrived I used the following video to guide me through replacing the sensor:


Once the sensor was replaced I needed to run another diagnostic since that is what Whirlpool recommends when replacing the turbidity sensor.  Once that was complete I tested out the dishwasher over the course of a few days running multiple loads per day.   Every cycle was successful so I could finally declare success.   I should note however that when I was replacing the sensor I noticed my water supply line was corroded and slightly leaking but I will save that story for another day.


Friday, December 17, 2021

ETCD: Where is my Memory?


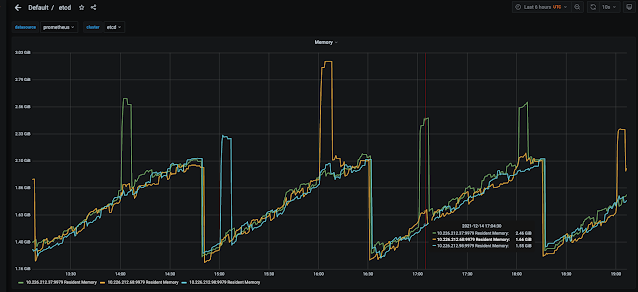
A colleague recently approached me about some cyclical etcd memory usage on their OpenShift clusters.  The pattern appeared to be a “sawtooth” or “run and jump” pattern when looking at the etcd memory utilization graphs.  The pattern happened every two hours where over the course of the two hours memory usage would gradually increase and then roughly at the two hour mark would abruptly drop back down to a more baseline level before repeating.  My colleague wanted to understand why this behavior was occurring and what was causing the memory to be freed.  In order to answer this question we first need to explore a little more about etcd and what things impact memory utilization and allow for free pages to be returned.


Etcd  can be summarized as a distributed key-value data store in OpenShift designed to be highly available and strongly consistent for distributed systems. OpenShift uses etcd to store all of its persistent cluster data, such as configs and metadata, allowing OpenShift services to remain scalable and stateless.

Etcd’s datastore is built on top of a fork of BoltDB called BBoltDB. Bolt is a key-value store that writes its data into a single memory mapped file which enables the underlying operating system to handle how data is cached and how much of the file remains in memory.   The underlying data structure for Bolt is B+ tree consisting of 4kb pages that are allocated as they are needed.  It should be noted that Bolt is very good with sequential writes but weak with random writes.  This will make more sense further in this discussion.


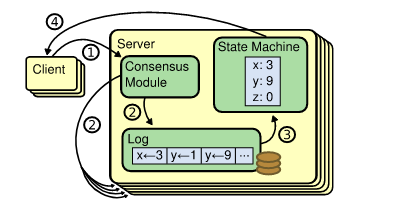
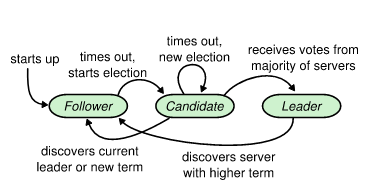
Along with Bolt in etcd is a protocol called Raft which is a consensus algorithm that is designed to be easy to understand and provide a way to distribute a state machine across a cluster of distributed systems.  Consensus, which involves a simple majority of servers agreeing on values, can be thought of as a highly available replication log between the nodes running etcd in the OpenShift cluster.  Raft works by electing a leader and then forcing all write requests to go to the leader.  Changes are then replicated from the leader to the other nodes in the etcd cluster.  If by chance the leader node goes offline due to maintenance or failure Raft will hold another election for a leader.


Etcds uses multiversion concurrency control (MVCC) in order to handle concurrent operations from different clients.  This ties into the Raft protocol as each version in MVCC relates to an index in the Raft log.  Etcd manages changes by revisions and thus every transaction made to etcd is a new revision.  By keeping a history of revisions, etcd is able to provide the version history for specific keys.  These keys are then in turn associated with their revision numbers along with their new values.  It's this key writing scheme that enabled etcd to make all writes sequential which reduces reliability on Bolts weakness above at random writes.

As we discussed above, etcd use of revisions and key history enables useful features for a key or set of keys.  However, etcds revisions can grow very large on a cluster and consume a lot of memory and disk.  Even if a large number of keys are deleted from the etcd cluster the space will continue to grow since the prior history for those keys will still exist.   This is where the concept of compaction comes into play.   Compaction in etcd will drop all previous revisions smaller than the revision being compacted to.   These compactions are just deletions in Bolt but they do remove keys from memory which will free up memory.   However if those keys have also been written to disk the disk will not be freed up until a defrag which can reclaim the space.

Circling back to my colleague's problem, I initially thought maybe a compaction job every two hours was the cause of his “sawtooth” graph of memory usage.  However it was confirmed that his compaction job was configured to run every 5 minutes.  This obviously did not correlate to the behavior we were seeing in the graphs.

Then I recalled, besides storing configs and metadata, etcd also stores events from the cluster.  These events would be stored just like we described above in key value pairs and would have revisions.  Although events would most likely never have new revisions because each event would be a unique key value pair.  Now every cluster event has an event-ttl assigned to it.  The event-ttl is just like one would imagine, a time to live before the event is removed or aged out.  The thought was maybe we had a persisting grouping of events happening that would age out over the time frame pattern we were seeing in the memory usage.  However upon investigating further we found the event-ttl was set to three hours.  Given our pattern was at a two hour scenario we abandoned looking any further at that option.

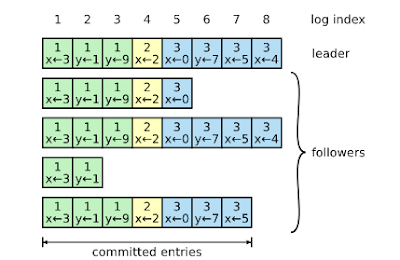
Then as I was looking through documentation about etcd I recalled that Raft with all of its responsibilities in etcd also does a form of compaction.  If we recall from above I indicated Raft has a log which contains indexes which just happens to be memory resident.   In etcd there is a configuration option called snapshot-count which controls the number of applied Raft entries to hold in memory before compaction executes.  In versions of etcd before v.3.2 that count was 10k but in v3.2 or greater the value has been set to 100k so ten times the amount of entries.  When the snapshot count on the leader server is reached the snapshot data is persisted to disk and then the old log is truncated.  If a slow follower requests logs before a compacted index is complete the leader will send a snapshot for the follower to just overwrite its state.   This was exactly the explanation for the behavior we were seeing.

Hopefully this walk through provided some details on how etcd works and how memory is impacted on a running cluster.  To read further on any of the topics feel free to explore these links:

Thursday, December 02, 2021

The Lowdown on Downward API in OpenShift


A customer approached me recently with a use case where they needed to have the OpenShift container know the hostname of the node it was running on.  They had found that the normal hostname file on Red Hat CoreOS was not on the node so they were not certain how they could derive the hostname value when they launched the custom daemonset they built.  Enter the downward API in OpenShift.

The downward API is a implementation that allows containers to consume information about API objects without integrating via the OpenShift API. Such information includes items like the pod’s name, namespace, and resource values. Containers can consume information from the downward API using environment variables or a volume file.

Lets go ahead and demonstrate the capabilities of the downward API with a simple example of how it can be used.  First lets create the following downward-secret.yaml file which will be used in our demonstration.  The secret file is just a basic secret nothing exciting:

$ cat << EOF > downward-secret.yaml
apiVersion: v1
kind: Secret
metadata:
  name: downwardsecret
data:
  password: cGFzc3dvcmQ=
  username: ZGV2ZWxvcGVy
type: kubernetes.io/basic-auth
EOF

Now lets create the secret on the OpenShift cluster:

$ oc create -f downward-secret.yaml
secret/downwardsecret created

Next lets create the following downward-pod.yaml file:

$ cat << EOF > downward-pod.yaml
apiVersion: v1
kind: Pod
metadata:
  name: downward-pod
spec:
  containers:
    - name: busybox-container
      image: k8s.gcr.io/busybox
      command: [ "sh", "-c"]
      args:
      - while true; do
          echo -en '\n';
          printenv NODENAME HOSTIP SERVICEACCT NAMESPACE;
          printenv DOWNWARD_SECRET;
          sleep 10;
        done;
      resources:
        requests:
          memory: "32Mi"
          cpu: "125m"
        limits:
          memory: "64Mi"
          cpu: "250m"
      volumeMounts:
        - name: downwardinfo
          mountPath: /etc/downwardinfo
          readOnly: false
          
      env:
        - name: NODENAME
          valueFrom:
            fieldRef:
              fieldPath: spec.nodeName
        - name: HOSTIP
          valueFrom:
            fieldRef:
              fieldPath: status.hostIP
        - name: SERVICEACCT
          valueFrom:
            fieldRef:
              fieldPath: spec.serviceAccountName
        - name: NAMESPACE
          valueFrom:
            fieldRef:
              fieldPath: metadata.namespace
        - name: DOWNWARD_SECRET
          valueFrom:
            secretKeyRef:
              name: downwardsecret
              key: username
  volumes:
    - name: downwardinfo
      downwardAPI:
        items:
          - path: "cpu_limit"
            resourceFieldRef:
              containerName: busybox-container
              resource: limits.cpu
          - path: "cpu_request"
            resourceFieldRef:
              containerName: busybox-container
              resource: requests.cpu
          - path: "mem_limit"
            resourceFieldRef:
              containerName: busybox-container
              resource: limits.memory
          - path: "mem_request"
            resourceFieldRef:
              containerName: busybox-container
              resource: requests.memory
EOF

Lets quickly take a look at the contents of that file which will create a pod called downward-pod and inside run a container called busybox-container using the busybox image:

$ cat downward-pod.yaml 
apiVersion: v1
kind: Pod
metadata:
  name: downward-pod
spec:
  containers:
    - name: busybox-container
      image: k8s.gcr.io/busybox
      command: [ "sh", "-c"]
      args:
      - while true; do
          echo -en '\n';
          printenv NODENAME HOSTIP SERVICEACCT NAMESPACE;
          printenv DOWNWARD_SECRET;
          sleep 10;
        done;
      resources:
        requests:
          memory: "32Mi"
          cpu: "125m"
        limits:
          memory: "64Mi"
          cpu: "250m"
      volumeMounts:
        - name: downwardinfo
          mountPath: /etc/downwardinfo
          readOnly: false
          
      env:
        - name: NODENAME
          valueFrom:
            fieldRef:
              fieldPath: spec.nodeName
        - name: HOSTIP
          valueFrom:
            fieldRef:
              fieldPath: status.hostIP
        - name: SERVICEACCT
          valueFrom:
            fieldRef:
              fieldPath: spec.serviceAccountName
        - name: NAMESPACE
          valueFrom:
            fieldRef:
              fieldPath: metadata.namespace
        - name: DOWNWARD_SECRET
          valueFrom:
            secretKeyRef:
              name: downwardsecret
              key: username
  volumes:
    - name: downwardinfo
      downwardAPI:
        items:
          - path: "cpu_limit"
            resourceFieldRef:
              containerName: busybox-container
              resource: limits.cpu
          - path: "cpu_request"
            resourceFieldRef:
              containerName: busybox-container
              resource: requests.cpu
          - path: "mem_limit"
            resourceFieldRef:
              containerName: busybox-container
              resource: limits.memory
          - path: "mem_request"
            resourceFieldRef:
              containerName: busybox-container
              resource: requests.memory


Under the container section we also defined some resources and added a volume mount. The volume mount will be used to mount up our downward api volume files which will consist of the resources we defined.  Those files will get mounted under the path /etc/downwardinfo inside the container:

      resources:
        requests:
          memory: "32Mi"
          cpu: "125m"
        limits:
          memory: "64Mi"
          cpu: "250m"
      volumeMounts:
        - name: downwardinfo
          mountPath: /etc/downwardinfo
          readOnly: false

Next there is a section where we defined some environment variables that reference some additional downward API values.  There is also a variable that references the downwardsecret.  All of these variables will get passed into the container to be consumed by whatever processes require them:

        env:
        - name: NODENAME
          valueFrom:
            fieldRef:
              fieldPath: spec.nodeName
        - name: HOSTIP
          valueFrom:
            fieldRef:
              fieldPath: status.hostIP
        - name: SERVICEACCT
          valueFrom:
            fieldRef:
              fieldPath: spec.serviceAccountName
        - name: NAMESPACE
          valueFrom:
            fieldRef:
              fieldPath: metadata.namespace
        - name: DOWNWARD_SECRET
          valueFrom:
            secretKeyRef:
              name: downwardsecret
              key: username

And finally there is a volumes section which defines the filename and the resource value field for the downwardinfo files that we want to pass into the container:

  volumes:
    - name: downwardinfo
      downwardAPI:
        items:
          - path: "cpu_limit"
            resourceFieldRef:
              containerName: busybox-container
              resource: limits.cpu
          - path: "cpu_request"
            resourceFieldRef:
              containerName: busybox-container
              resource: requests.cpu
          - path: "mem_limit"
            resourceFieldRef:
              containerName: busybox-container
              resource: limits.memory
          - path: "mem_request"
            resourceFieldRef:
              containerName: busybox-container
              resource: requests.memory


Now that we have an idea of what the downward-pod.yaml does lets go ahead and run the pod:

$ oc create -f downward-pod.yaml 
pod/downward-pod created
$ oc get pod
NAME           READY   STATUS    RESTARTS   AGE
downward-pod   1/1     Running   0          6s

With the pod running we can now validate that the downward API variables and volume files we set.  First lets just look at the pod log and see if the variables we defined and printed in our argument loop show the right values:

$ oc logs downward-pod

master-0.kni20.schmaustech.com
192.168.0.210
default
default
developer

master-0.kni20.schmaustech.com
192.168.0.210
default
default
developer


The variables look to be populated correctly with the right hostname, host IP address, namespace and serviceaccount.   Even the username for our secret is showing up correctly as developer.   Since that looks correct lets move on and execute a shell in the pod:

$ oc exec -it downward-pod sh
kubectl exec [POD] [COMMAND] is DEPRECATED and will be removed in a future version. Use kubectl exec [POD] -- [COMMAND] instead.
/ # 

Once inside lets print the environment out and see if our variables are listed there as well:

/ # printenv
KUBERNETES_PORT=tcp://172.30.0.1:443
KUBERNETES_SERVICE_PORT=443
HOSTNAME=downward-pod
SHLVL=1
HOME=/root
TERM=xterm
KUBERNETES_PORT_443_TCP_ADDR=172.30.0.1
PATH=/usr/local/sbin:/usr/local/bin:/usr/sbin:/usr/bin:/sbin:/bin
KUBERNETES_PORT_443_TCP_PORT=443
KUBERNETES_PORT_443_TCP_PROTO=tcp
HOSTIP=192.168.0.210
DOWNWARD_SECRET=developer
NAMESPACE=default
KUBERNETES_PORT_443_TCP=tcp://172.30.0.1:443
KUBERNETES_SERVICE_PORT_HTTPS=443
PWD=/
KUBERNETES_SERVICE_HOST=172.30.0.1
SERVICEACCT=default
NSS_SDB_USE_CACHE=no
NODENAME=master-0.kni20.schmaustech.com

Again the environment variables we defined are showing up and could be consumed by a process within the container. 

Now lets explore our volume files and confirm they too were set.   We can see the /etc/downwardinfo directory and four files exist:

/ # ls /etc/downwardinfo
cpu_limit    cpu_request  mem_limit    mem_request

Lets look at the contents of the four files:

/ # echo "$(cat /etc/downwardinfo/cpu_limit)"
1
/ # echo "$(cat /etc/downwardinfo/cpu_request)"
1
/ # echo "$(cat /etc/downwardinfo/mem_limit)"
67108864
/ # echo "$(cat /etc/downwardinfo/mem_request)"
33554432


The values in the files look correct and correspond to the resource values we defined in the downward-pod.yaml file that launched this pod.

At this point we have validated that the downward API does indeed provide information into the pod and can present itself either as an environment variable for a volume file.  So if anyone every asks how to get the hostname of the node the pod is running on as an environment variable inside the pod just keep the downward API in mind.