Sunday, February 06, 2022

Enabling vGPU in OpenShift Containerized Virtualization

There is a lot of discussion about using GPUs for AI/ML workloads and while some of those workloads run in containers there are still some use cases where those workloads run in virtual machines.   In OpenShift when using Containerized virtualization one can run virtual machines and use a PCI passhthrough configuration to pass up one of the GPUs into the virtual machine.  This is clearly defined in the documentation here.  However there are some cases where the entire GPU is not needed by the virtual machine and so rather then have wasted cycles we can pass a slice of the GPU into the virtual machine as a vGPU.   In this blog I will demonstrate how to configure and pass up a virtual GPU into a virtual Linux machine.

Before we begin lets make a few assumptions about what has already been configured.   We assume that we have a working OpenShift 4.9 cluster, could be a full cluster, a compact cluster or in my case just a single node cluster (SNO).   We also can assume that Containerized virtualization and Node Feature Discovery operator has been installed via OperatorHub.


Now that we have the basic assumptions out of the way lets begin the process of enabling virtual GPUs.   The very first step is to label the nodes that have a GPU installed:

$ oc get nodes
NAME    STATUS   ROLES           AGE   VERSION
sno2    Ready    master,worker   1d   v1.22.3+e790d7f

$ oc label nodes sno2 hasGpu=true
node/sno2 labeled

With the labeling of the node which will be used later when we deploy the driver we can now create the MachineConfig to enable the IOMMU: 

$ cat << EOF > ~/100-master-kernel-arg-iommu.yaml
apiVersion: machineconfiguration.openshift.io/v1
kind: MachineConfig
metadata:
    machineconfiguration.openshift.io/role: master 
  name: 100-master-iommu 
spec:
  config:
    ignition:
      version: 3.2.0
  kernelArguments:
      - intel_iommu=on
EOF

With the MachineConfig created lets go ahead and apply it to the cluster:

$ oc create -f ~/100-master-kernel-arg-iommu.yaml
machineconfig.machineconfiguration.openshift.io/100-master-iommu created

Wait for the nodes where the machine config is applied to reboot.  Once the nodes have rebooted we can continue onto the next step.

Once the nodes have rebooted we can verify the MachineConfig was applied by running the following:

$ oc get MachineConfig 100-master-iommu
NAME               GENERATEDBYCONTROLLER   IGNITIONVERSION   AGE
100-master-iommu                           3.2.0             6m25s

Now lets go ahead and build the driver container that will apply the NVIDIA driver to the worker nodes that have GPUs in them.   I should note that in order to proceed the NVIDIA GRID drivers need to be obtained from NVIDIA here.  I will be using the following driver in this example to build my container: NVIDIA-Linux-x86_64-470.63-vgpu-kvm.run.  The first step we need to do is determine the driver-toolkit release image our current cluster is using.  We can find that by running the following command:

$ oc adm release info --image-for=driver-toolkit
quay.io/openshift-release-dev/ocp-v4.0-art-dev@sha256:ce897bc72101dacc82aa593974fa0d8a421a43227b540fbcf1e303ffb1d3f1ea

Next we will take that release image and place it into a Dockerfile in a directory called vgpu: 

$ cat << EOF > ~/vgpu/Dockerfile
FROM quay.io/openshift-release-dev/ocp-v4.0-art-dev@sha256:ce897bc72101dacc82aa593974fa0d8a421a43227b540fbcf1e303ffb1d3f1ea
ARG NVIDIA_INSTALLER_BINARY
ENV NVIDIA_INSTALLER_BINARY=${NVIDIA_INSTALLER_BINARY:-NVIDIA-Linux-x86_64-470.63-vgpu-kvm.run}

RUN dnf -y install git make sudo gcc \
&& dnf clean all \
&& rm -rf /var/cache/dnf

RUN mkdir -p /root/nvidia
WORKDIR /root/nvidia
ADD ${NVIDIA_INSTALLER_BINARY} .
RUN chmod +x /root/nvidia/${NVIDIA_INSTALLER_BINARY}
ADD entrypoint.sh .
RUN chmod +x /root/nvidia/entrypoint.sh

RUN mkdir -p /root/tmp
EOF

Next create the following entrypoint.sh script and place that in the vgpu directory as well:

$ cat << EOF > ~/vgpu/entrypoint.sh
#!/bin/sh
/usr/sbin/rmmod nvidia
/root/nvidia/${NVIDIA_INSTALLER_BINARY} --kernel-source-path=/usr/src/kernels/$(uname -r) --kernel-install-path=/lib/modules/$(uname -r)/kernel/drivers/video/ --silent --tmpdir /root/tmp/ --no-systemd

/usr/bin/nvidia-vgpud &
/usr/bin/nvidia-vgpu-mgr &

while true; do sleep 15 ; /usr/bin/pgrep nvidia-vgpu-mgr ; if [ $? -ne 0 ] ; then echo "nvidia-vgpu-mgr is not running" && exit 1; fi; done
EOF

Also place the NVIDIA-Linux-x86_64-470.63-vgpu-kvm.run in to the vgpu directory.   Then you should have the following:

$ ls
Dockerfile  entrypoint.sh  NVIDIA-Linux-x86_64-470.63-vgpu-kvm.run


At this point change directory into vgpu and then use the podman build command to build the driver container local:

$ cd ~/vgpu
$ podman build --build-arg NVIDIA_INSTALLER_BINARY=NVIDIA-Linux-x86_64-470.63-vgpu-kvm.run -t ocp-nvidia-vgpu-installer .
STEP 1/11: FROM quay.io/openshift-release-dev/ocp-v4.0-art-dev@sha256:ce897bc72101dacc82aa593974fa0d8a421a43227b540fbcf1e303ffb1d3f1ea
STEP 2/11: ARG NVIDIA_INSTALLER_BINARY
--> Using cache 13aa17a1fd44bb7afea0a1b884b7005aaa51091e47dfe14987b572db9efab1f2
--> 13aa17a1fd4
STEP 3/11: ENV NVIDIA_INSTALLER_BINARY=${NVIDIA_INSTALLER_BINARY:-NVIDIA-Linux-x86_64-470.63-vgpu-kvm.run}
--> Using cache e818b281ad40c0e78ef4c01a71d73b45b509392100262fddbf542c457d697255
--> e818b281ad4
STEP 4/11: RUN dnf -y install git make sudo gcc && dnf clean all && rm -rf /var/cache/dnf
--> Using cache d6f3687a545589cf096353ad792fb464a6961ff204c49234ced26d996da9f1c8
--> d6f3687a545
STEP 5/11: RUN mkdir -p /root/nvidia
--> Using cache 708b464de69de2443edb5609623478945af6f9498d73bf4d47c577e29811a414
--> 708b464de69
STEP 6/11: WORKDIR /root/nvidia
--> Using cache 6cb724eeb99d21a30f50a3c25954426d4719af84ef43bda7ab0aeab6e7da81a8
--> 6cb724eeb99
STEP 7/11: ADD ${NVIDIA_INSTALLER_BINARY} .
--> Using cache 71dd0491be7e3c20a742cd50efe26f54a5e2f61d4aa8846cd5d7ccd82f27ab45
--> 71dd0491be7
STEP 8/11: RUN chmod +x /root/nvidia/${NVIDIA_INSTALLER_BINARY}
--> Using cache 85d64dc8b702936412fa121aaab3733a60f880aa211e0197f1c8853ddbb617b5
--> 85d64dc8b70
STEP 9/11: ADD entrypoint.sh .
--> Using cache 9d49c87387f926ec39162c5e1c2a7866c1494c1ab8f3912c53ea6eaefe0be254
--> 9d49c87387f
STEP 10/11: RUN chmod +x /root/nvidia/entrypoint.sh
--> Using cache 79d682f8471fc97a60b6507d2cff164b3b9283a1e078d4ddb9f8138741c033b5
--> 79d682f8471
STEP 11/11: RUN mkdir -p /root/tmp
--> Using cache bcbb311e35999cb6c55987049033c5d278ee93d76a97fe9203ce68257a9f8ebd
COMMIT ocp-nvidia-vgpu-installer
--> bcbb311e359
Successfully tagged localhost/ocp-nvidia-vgpu-installer:latest
Successfully tagged localhost/ocp-nvidia-vgpu-nstaller:latest
Successfully tagged quay.io/bschmaus/ocp-nvidia-vgpu-nstaller:latest
bcbb311e35999cb6c55987049033c5d278ee93d76a97fe9203ce68257a9f8ebd

Once the container is build push it to a private repository that is only accessible by the organization that purchased the NVIDIA GRID license.  It is not legal to freely distribute the driver image. 

$ podman push quay.io/bschmaus/ocp-nvidia-vgpu-nstaller:latest
Getting image source signatures
Copying blob b0b1274fc88c done  
Copying blob 525ed45dbdb1 done  
Copying blob 8aa226ded434 done  
Copying blob d9ad9932e964 done  
Copying blob 5bc03dec6239 done  
Copying blob ab10e1e28fa3 done  
Copying blob 4eff86c961b3 done  
Copying blob e1790381e6f7 done  
Copying blob a8701ba769cc done  
Copying blob 38a3912b1d62 done  
Copying blob 257db9f06185 done  
Copying blob 09fd8acd3579 done  
Copying config bcbb311e35 done  
Writing manifest to image destination
Copying config bcbb311e35 [--------------------------------------] 0.0b / 5.6KiB
Writing manifest to image destination
Storing signatures


Now that we have a driver image lets create a custom resource that will use and apply that driver image to the cluster nodes that have the label hasGPU via a deamonset.  The file will look similar below but will need the container image path to be updated to fit ones environment.

$ cat << EOF > ~/1000-drivercontainer.yaml
apiVersion: v1
kind: ServiceAccount
metadata:
  name: simple-kmod-driver-container
---
apiVersion: rbac.authorization.k8s.io/v1
kind: Role
metadata:
  name: simple-kmod-driver-container
rules:
- apiGroups:
  - security.openshift.io
  resources:
  - securitycontextconstraints
  verbs:
  - use
  resourceNames:
  - privileged
---
apiVersion: rbac.authorization.k8s.io/v1
kind: RoleBinding
metadata:
  name: simple-kmod-driver-container
roleRef:
  apiGroup: rbac.authorization.k8s.io
  kind: Role
  name: simple-kmod-driver-container
subjects:
- kind: ServiceAccount
  name: simple-kmod-driver-container
userNames:
- system:serviceaccount:simple-kmod-demo:simple-kmod-driver-container
---
apiVersion: apps/v1
kind: DaemonSet
metadata:
  name: simple-kmod-driver-container
spec:
  selector:
    matchLabels:
      app: simple-kmod-driver-container
  template:
    metadata:
      labels:
        app: simple-kmod-driver-container
    spec:
      serviceAccount: simple-kmod-driver-container
      serviceAccountName: simple-kmod-driver-container
      hostPID: true
      hostIPC: true
      containers:
      - image: quay.io/bschmaus/ocp-nvidia-vgpu-nstaller:latest
        name: simple-kmod-driver-container
        imagePullPolicy: Always
        command: ["/root/nvidia/entrypoint.sh"]
        lifecycle:
          preStop:
            exec:
              command: ["/bin/sh", "-c", "systemctl stop kmods-via-containers@simple-kmod"]
        securityContext:
          privileged: true

          allowedCapabilities:
          - '*'
          capabilities:
            add: ["SYS_ADMIN"]
        volumeMounts:
        - mountPath: /dev/vfio/
          name: vfio
        - mountPath: /sys/fs/cgroup
          name: cgroup
      volumes:
      - hostPath:
          path: /sys/fs/cgroup
          type: Directory
        name: cgroup
      - hostPath:
          path: /dev/vfio/
          type: Directory
        name: vfio
      nodeSelector:
        hasGpu: "true"
EOF

Now that we have our custom resource driver yaml lets apply it to the cluster:

$ oc create -f 1000-drivercontainer.yaml
serviceaccount/simple-kmod-driver-container created
role.rbac.authorization.k8s.io/simple-kmod-driver-container created
rolebinding.rbac.authorization.k8s.io/simple-kmod-driver-container created
daemonset.apps/simple-kmod-driver-container created

We can validate the daemonset is running by looking at the daemonsets under openshift-nfd:

$ oc get daemonset simple-kmod-driver-container 
NAME                           DESIRED   CURRENT   READY   UP-TO-DATE   AVAILABLE   NODE SELECTOR   AGE
simple-kmod-driver-container   1         1         1       1            1           hasGpu=true     9m23s

Now lets further validate by logging into the worker node as the core user, sudo up to root and then list out the loaded kernel modules.  We should see the NVIDIA drivers loaded:

# sudo bash
# lsmod| grep nvi
nvidia_vgpu_vfio       65536  0
nvidia              35274752  10 nvidia_vgpu_vfio
mdev                   20480  2 vfio_mdev,nvidia_vgpu_vfio
vfio                   36864  3 vfio_mdev,nvidia_vgpu_vfio,vfio_iommu_type1
drm                   569344  4 drm_kms_helper,nvidia,mgag200

Once we have confirmed the NVIDIA drivers are loaded lets enumerate through the possible mdev_type devices for our GPU card.   Using the commands below we can show what the different options are for carving up the GPU card from a vGPU perspective.  In our example below we have a variety of ways we could use this card.  However it should be noted that only one nvidia-(n) device can be used.  That is if we choose nvidia-22 and carve up each GPU into a single vGPU then we end up with one vGPU per physical GPU on the card.   As another example if we chose nvidia-15 we would then end up with 8 vGPUs per physical GPU on the card.

# for device in /sys/class/mdev_bus/*; do for mdev_type in "$device"/mdev_supported_types/*; do     MDEV_TYPE=$(basename $mdev_type);     DESCRIPTION=$(cat $mdev_type/description);     NAME=$(cat $mdev_type/name); echo "mdev_type: $MDEV_TYPE --- description: $DESCRIPTION --- name: $NAME";   done; done | sort | uniq
mdev_type: nvidia-11 --- description: num_heads=2, frl_config=45, framebuffer=512M, max_resolution=2560x1600, max_instance=16 --- name: GRID M60-0B
mdev_type: nvidia-12 --- description: num_heads=2, frl_config=60, framebuffer=512M, max_resolution=2560x1600, max_instance=16 --- name: GRID M60-0Q
mdev_type: nvidia-13 --- description: num_heads=1, frl_config=60, framebuffer=1024M, max_resolution=1280x1024, max_instance=8 --- name: GRID M60-1A
mdev_type: nvidia-14 --- description: num_heads=4, frl_config=45, framebuffer=1024M, max_resolution=5120x2880, max_instance=8 --- name: GRID M60-1B
mdev_type: nvidia-15 --- description: num_heads=4, frl_config=60, framebuffer=1024M, max_resolution=5120x2880, max_instance=8 --- name: GRID M60-1Q
mdev_type: nvidia-16 --- description: num_heads=1, frl_config=60, framebuffer=2048M, max_resolution=1280x1024, max_instance=4 --- name: GRID M60-2A
mdev_type: nvidia-17 --- description: num_heads=4, frl_config=45, framebuffer=2048M, max_resolution=5120x2880, max_instance=4 --- name: GRID M60-2B
mdev_type: nvidia-18 --- description: num_heads=4, frl_config=60, framebuffer=2048M, max_resolution=5120x2880, max_instance=4 --- name: GRID M60-2Q
mdev_type: nvidia-19 --- description: num_heads=1, frl_config=60, framebuffer=4096M, max_resolution=1280x1024, max_instance=2 --- name: GRID M60-4A
mdev_type: nvidia-20 --- description: num_heads=4, frl_config=60, framebuffer=4096M, max_resolution=5120x2880, max_instance=2 --- name: GRID M60-4Q
mdev_type: nvidia-210 --- description: num_heads=4, frl_config=45, framebuffer=2048M, max_resolution=5120x2880, max_instance=4 --- name: GRID M60-2B4
mdev_type: nvidia-21 --- description: num_heads=1, frl_config=60, framebuffer=8192M, max_resolution=1280x1024, max_instance=1 --- name: GRID M60-8A
mdev_type: nvidia-22 --- description: num_heads=4, frl_config=60, framebuffer=8192M, max_resolution=5120x2880, max_instance=1 --- name: GRID M60-8Q
mdev_type: nvidia-238 --- description: num_heads=4, frl_config=45, framebuffer=1024M, max_resolution=5120x2880, max_instance=8 --- name: GRID M60-1B4

In my example I am going to go ahead and use nvidia-22 and only pass one vGPU per physical GPU.  To do this we need to echo a unique uuid number into the following device path create file.   I will do this twice once for each physical GPU device.  Note that this can only be done once.  If attempted more then once an IO error will result.

# echo `uuidgen` > /sys/class/mdev_bus/0000:3e:00.0/mdev_supported_types/nvidia-22/create
# echo `uuidgen` > /sys/class/mdev_bus/0000:3d:00.0/mdev_supported_types/nvidia-22/create

Now that we have created our vGPU devices we next need to expose those devices to Containerized virtualization so they can then be consumed by a virtual machine.  To do this we need to patch the kubevirt-hyperconverged configuration.  So first lets create the patch file:

$ cat << EOF > ~/kubevirt-hyperconverged-patch.yaml
spec:
    permittedHostDevices:
      mediatedDevices:
      - mdevNameSelector: "GRID M60-8Q"
        resourceName: "nvidia.com/GRID_M60_8Q"
EOF

With the patch file created we next need to merge it with the existing kubevirt-hyperconverged configuration using the oc patch command:

$ oc patch hyperconverged kubevirt-hyperconverged -n openshift-cnv --patch "$(cat ~/kubevirt-hyperconverged-patch.yaml)" --type=merge
hyperconverged.hco.kubevirt.io/kubevirt-hyperconverged patched

Once applied wait a few minutes for the configuration to be reloaded.  Then to validate it run the oc describe node command against the node and look for the GPU devices under Capacity and Allocatable.   In our example we see two devices because we had 2 physical GPUs and we created a vGPU using nvidia-22 which allows for one vGPU per physical GPU.

$ oc describe node| sed '/Capacity/,/System/!d;/System/d'
Capacity:
  cpu:                            24
  devices.kubevirt.io/kvm:        1k
  devices.kubevirt.io/tun:        1k
  devices.kubevirt.io/vhost-net:  1k
  ephemeral-storage:              936104940Ki
  hugepages-1Gi:                  0
  hugepages-2Mi:                  0
  memory:                         131561680Ki
  nvidia.com/GRID_M60_8Q:         2
  pods:                           250
Allocatable:
  cpu:                            23500m
  devices.kubevirt.io/kvm:        1k
  devices.kubevirt.io/tun:        1k
  devices.kubevirt.io/vhost-net:  1k
  ephemeral-storage:              862714311276
  hugepages-1Gi:                  0
  hugepages-2Mi:                  0
  memory:                         130410704Ki
  nvidia.com/GRID_M60_8Q:         2
  pods:                           250

At this point VMs can now be deployed and consume the available vGPUs on the node.  To do this we need to create a VM resource configuration file like the example below.  Notice that we define in this file host devices and we pass in the NVIDIA host device of the vGPU name:

$ cat << EOF > ~/fedora-vm.yaml
apiVersion: kubevirt.io/v1
kind: VirtualMachine
metadata:
  annotations:
    kubemacpool.io/transaction-timestamp: '2022-02-09T17:23:53.76596817Z'
    kubevirt.io/latest-observed-api-version: v1
    kubevirt.io/storage-observed-api-version: v1alpha3
    name.os.template.kubevirt.io/fedora34: Fedora 33 or higher
    vm.kubevirt.io/validations: |
      [
        {
          "name": "minimal-required-memory",
          "path": "jsonpath::.spec.domain.resources.requests.memory",
          "rule": "integer",
          "message": "This VM requires more memory.",
          "min": 1073741824
        }
      ]
  resourceVersion: '19096098'
  name: fedora
  uid: 48bf787d-9240-444c-92fd-f0e5ce0ced23
  creationTimestamp: '2022-02-09T16:48:54Z'
  generation: 3
  managedFields:
    - apiVersion: kubevirt.io/v1
      fieldsType: FieldsV1
      fieldsV1:
        'f:metadata':
          'f:annotations':
            .: {}
            'f:name.os.template.kubevirt.io/fedora34': {}
            'f:vm.kubevirt.io/validations': {}
          'f:labels':
            .: {}
            'f:app': {}
            'f:os.template.kubevirt.io/fedora34': {}
            'f:vm.kubevirt.io/template': {}
            'f:vm.kubevirt.io/template.namespace': {}
            'f:vm.kubevirt.io/template.revision': {}
            'f:vm.kubevirt.io/template.version': {}
            'f:workload.template.kubevirt.io/server': {}
        'f:spec':
          .: {}
          'f:dataVolumeTemplates': {}
          'f:template':
            .: {}
            'f:metadata':
              .: {}
              'f:annotations': {}
              'f:labels': {}
            'f:spec':
              .: {}
              'f:domain':
                .: {}
                'f:cpu':
                  .: {}
                  'f:cores': {}
                  'f:sockets': {}
                  'f:threads': {}
                'f:devices':
                  .: {}
                  'f:disks': {}
                  'f:interfaces': {}
                  'f:networkInterfaceMultiqueue': {}
                  'f:rng': {}
                'f:machine':
                  .: {}
                  'f:type': {}
                'f:resources':
                  .: {}
                  'f:requests':
                    .: {}
                    'f:memory': {}
              'f:evictionStrategy': {}
              'f:hostname': {}
              'f:networks': {}
              'f:terminationGracePeriodSeconds': {}
              'f:volumes': {}
      manager: Mozilla
      operation: Update
      time: '2022-02-09T16:48:54Z'
    - apiVersion: kubevirt.io/v1alpha3
      fieldsType: FieldsV1
      fieldsV1:
        'f:status':
          'f:conditions': {}
          'f:printableStatus': {}
      manager: Go-http-client
      operation: Update
      subresource: status
      time: '2022-02-09T17:23:53Z'
  namespace: openshift-nfd
  labels:
    app: fedora
    os.template.kubevirt.io/fedora34: 'true'
    vm.kubevirt.io/template: fedora-server-large
    vm.kubevirt.io/template.namespace: openshift
    vm.kubevirt.io/template.revision: '1'
    vm.kubevirt.io/template.version: v0.16.4
    workload.template.kubevirt.io/server: 'true'
spec:
  dataVolumeTemplates:
    - metadata:
        creationTimestamp: null
        name: fedora-rootdisk-uqf5j
      spec:
        pvc:
          accessModes:
            - ReadWriteOnce
          resources:
            requests:
              storage: 40Gi
          storageClassName: hostpath-provisioner
          volumeMode: Filesystem
        source:
          http:
            url: >-
              https://download-ib01.fedoraproject.org/pub/fedora/linux/releases/34/Cloud/x86_64/images/Fedora-Cloud-Base-34-1.2.x86_64.raw.xz
  running: true
  template:
    metadata:
      annotations:
        vm.kubevirt.io/flavor: large
        vm.kubevirt.io/os: fedora
        vm.kubevirt.io/workload: server
      creationTimestamp: null
      labels:
        kubevirt.io/domain: fedora
        kubevirt.io/size: large
        os.template.kubevirt.io/fedora34: 'true'
        vm.kubevirt.io/name: fedora
        workload.template.kubevirt.io/server: 'true'
    spec:
      domain:
        cpu:
          cores: 12
          sockets: 1
          threads: 1
        devices:
          disks:
            - disk:
                bus: virtio
              name: cloudinitdisk
            - bootOrder: 1
              disk:
                bus: virtio
              name: rootdisk
          hostDevices:
            - deviceName: nvidia.com/GRID_M60_8Q
              name: GRID_M60_8Q
          interfaces:
            - macAddress: '02:01:53:00:00:00'
              masquerade: {}
              model: virtio
              name: default
          networkInterfaceMultiqueue: true
          rng: {}
        machine:
          type: pc-q35-rhel8.4.0
        resources:
          requests:
            memory: 32Gi
      evictionStrategy: LiveMigrate
      hostname: fedora
      networks:
        - name: default
          pod: {}
      terminationGracePeriodSeconds: 180
      volumes:
        - cloudInitNoCloud:
            userData: |
              #cloud-config
              user: fedora
              password: password
              chpasswd:
                expire: false
              ssh_authorized_keys:
                - >-
                  ssh-rsa
                  SSH-KEY-HERE
          name: cloudinitdisk
        - dataVolume:
            name: fedora-rootdisk-uqf5j
          name: rootdisk
status:
  conditions:
    - lastProbeTime: '2022-02-09T17:24:09Z'
      lastTransitionTime: '2022-02-09T17:24:09Z'
      message: VMI does not exist
      reason: VMINotExists
      status: 'False'
      type: Ready
  printableStatus: Stopped
  volumeSnapshotStatuses:
    - enabled: false
      name: cloudinitdisk
      reason: 'Snapshot is not supported for this volumeSource type [cloudinitdisk]'
    - enabled: false
      name: rootdisk
      reason: >-
        No VolumeSnapshotClass: Volume snapshots are not configured for this
        StorageClass [hostpath-provisioner] [rootdisk]
EOF

Lets go ahead and create the virtual machine: 

$ oc create -f ~/fedora-vm.yaml
virtualmachine.kubevirt.io/fedora created

Wait a few moments for the virtual machine to get to a running state.   We can confirm its running by doing oc get vms:

$ oc get vms
NAME              AGE     STATUS    READY
fedora            8m17s   Running   True

Now lets expose the running virtual machines ssh port so we can ssh into it by using the virtctl command:

$ virtctl expose vmi fedora --port=22 --name=fedora-ssh --type=NodePort
Service fedora-ssh successfully exposed for vmi fedora

We can confirm the ssh port is exposed and get the port number it uses by running the oc get svc command:

$ oc get svc
NAME                                     TYPE        CLUSTER-IP       EXTERNAL-IP   PORT(S)           AGE
fedora-ssh                               NodePort    172.30.220.248   none          22:30106/TCP      7s

Now lets ssh into the fedora virtual machine and become root:

$ ssh fedora@10.11.176.230 -p 30106
The authenticity of host '[10.11.176.230]:30106 ([10.11.176.230]:30106)' can't be established.
ECDSA key fingerprint is SHA256:Zmpcpm8vgQc3Oa72RFL0iKU/OPjHshAbHyGO7Smk8oE.
Are you sure you want to continue connecting (yes/no/[fingerprint])? yes
Warning: Permanently added '[10.11.176.230]:30106' (ECDSA) to the list of known hosts.
Last login: Wed Feb  9 18:41:14 2022
[fedora@fedora ~]$ sudo bash
[root@fedora fedora]#

Once at a root prompt we can execute lspci and see the NVIDIA vGPU we passed to the virtual machine is listed as a device:

[root@fedora fedora]# lspci|grep NVIDIA
06:00.0 VGA compatible controller: NVIDIA Corporation GM204GL [Tesla M60] (rev a1)

At this point all that one would need to do is install the NVIDIA drivers on the virtual machine and then fire up their favorite application that would take advantage of the vGPU in the virtual machine!

Tuesday, January 11, 2022

Adding VmWare Worker Node to OpenShift Cluster the BareMetal IPI Way


In a previous blog I discussed how one could provide Intelligent Platform Management Interface (IPMI) capabilities to a VmWare virtual machine.  I also eluded to being able to deploy OpenShift Baremetal IPI on VmWare virtual machines given the IPMI requirement was met for the purpose of a non production lab scenario.   However since I do not have enough lab equipment to run a full blown VmWare ESXi with enough virtual machines to mimic an OpenShift Baremetal IPI deployment, I will do the next best thing and demonstrate how to add a VmWare virtual machine acting as an OpenShift worker using the scale up capability.

Before we get started though lets review the lab setup for this exercise.   The diagram below shows that we have a 3 master cluster on a RHEL KVM hypervisor node.  These nodes while virtual are using VBMC to enable IPMI and hence the cluster was deployed as a OpenShift Baremetal IPI cluster.   We have an additional worker we would like to add that resides on an ESXi hypervisor host.   Using the virtualbmcforvsphere container (discussed in a previous blog) we can mimic IPMI for that worker node and thus treat it like a baremetal node.

Now that we have an understanding of the lab layout lets get to adding the additional VmWare worker node to our cluster.   The first step is to create the vmware-bmh.yaml which will contain the secret information for the IPMI credentials base64 encoded and the baremetal host information:

$ cat << EOF > ~/vmware-bmh.yaml
---
apiVersion: v1
kind: Secret
metadata:
  name: worker-4-bmc-secret
type: Opaque
data:
  username: YWRtaW4=
  password: cGFzc3dvcmQ=
---
apiVersion: metal3.io/v1alpha1
kind: BareMetalHost
metadata:
  name: worker-4
spec:
  online: true
  bootMACAddress: 00:50:56:83:da:a1
  bmc:
    address: ipmi://192.168.0.10:6801
    credentialsName: worker-4-bmc-secret
EOF

Once we have created the vmware-bmh.yaml file we can go ahead and create the resources with the oc command below:

$ oc create -f vmware-bmh.yaml -n openshift-machine-api
secret/worker-4-bmc-secret created
baremetalhost.metal3.io/worker-4 created	

Once the command is executed this will kick off the process of registering the node in ironic, turning the node on via IPMI and then inspecting the node to determine its resource properties.  The video below will show what is happening on the console of the worker node during this process:


Besides watching from the console, we can also run some oc commands to see the status of the worker node during this process as well:

$ oc get baremetalhosts -n openshift-machine-api
NAME       STATE                    CONSUMER               ONLINE   ERROR
master-0   externally provisioned   kni20-cmq65-master-0   true     
master-1   externally provisioned   kni20-cmq65-master-1   true     
master-2   externally provisioned   kni20-cmq65-master-2   true     
worker-4   registering                                     true 
$ oc get baremetalhosts -n openshift-machine-api
NAME       STATE                    CONSUMER               ONLINE   ERROR
master-0   externally provisioned   kni20-cmq65-master-0   true     
master-1   externally provisioned   kni20-cmq65-master-1   true     
master-2   externally provisioned   kni20-cmq65-master-2   true     
worker-4   inspecting                                      true     

$ oc get baremetalhosts -n openshift-machine-api
NAME       STATE                    CONSUMER               ONLINE   ERROR
master-0   externally provisioned   kni20-cmq65-master-0   true     
master-1   externally provisioned   kni20-cmq65-master-1   true     
master-2   externally provisioned   kni20-cmq65-master-2   true     
worker-4   match profile                                   true     

$ oc get baremetalhosts -n openshift-machine-api
NAME       STATE                    CONSUMER               ONLINE   ERROR
master-0   externally provisioned   kni20-cmq65-master-0   true     
master-1   externally provisioned   kni20-cmq65-master-1   true     
master-2   externally provisioned   kni20-cmq65-master-2   true     
worker-4   ready                                           true  

Once the process is complete the new worker node will be marked ready and left powered on.  Now we can move onto scaling up the cluster.   To do this we first need to find the name of the machineset which in this case is kni20-cmq65-worker-0.  With that information we can then scale up the node count from 0 to 1 and this will trigger the provisioning process:

$ oc -n openshift-machine-api get machineset
NAME                   DESIRED   CURRENT   READY   AVAILABLE   AGE
kni20-cmq65-worker-0   0         0                             17h

$ oc -n openshift-machine-api scale machineset kni20-cmq65-worker-0 --replicas=1
machineset.machine.openshift.io/kni20-cmq65-worker-0 scaled

The video below will show what happens during the scaling process from the worker nodes console point of view.  In summary what will happen is the node will turn on, an RHCOS image will get written, the node will reboot, the ostree will get updated, the node will reboot again and finally the services to enable the node to join the cluster will start:


Besides watching from the console of the worker node we can also following along at the cli with the oc command to show the state of the worker node:

$ oc get baremetalhosts -n openshift-machine-api
NAME       STATE                    CONSUMER                     ONLINE   ERROR
master-0   externally provisioned   kni20-cmq65-master-0         true     
master-1   externally provisioned   kni20-cmq65-master-1         true     
master-2   externally provisioned   kni20-cmq65-master-2         true     
worker-4   provisioning             kni20-cmq65-worker-0-lhd92   true 

And again using the oc command we can see the worker node has been provisioned:

$ oc get baremetalhosts -n openshift-machine-api
NAME       STATE                    CONSUMER                     ONLINE   ERROR
master-0   externally provisioned   kni20-cmq65-master-0         true     
master-1   externally provisioned   kni20-cmq65-master-1         true     
master-2   externally provisioned   kni20-cmq65-master-2         true     
worker-4   provisioned              kni20-cmq65-worker-0-lhd92   true 

Once the worker node has shown provisioned and the node has rebooted the second time, we can then follow the status of the worker node with the oc get nodes command: 

$ oc get nodes
NAME                             STATUS     ROLES           AGE   VERSION
master-0.kni20.schmaustech.com   Ready      master,worker   17h   v1.22.0-rc.0+a44d0f0
master-1.kni20.schmaustech.com   Ready      master,worker   17h   v1.22.0-rc.0+a44d0f0
master-2.kni20.schmaustech.com   Ready      master,worker   17h   v1.22.0-rc.0+a44d0f0
worker-4.kni20.schmaustech.com   NotReady   worker          39s   v1.22.0-rc.0+a44d0f0

Finally after the scaling process is completed and the worker node should display that it is ready and joined to the cluster:

$ oc get nodes
NAME                             STATUS   ROLES           AGE   VERSION
master-0.kni20.schmaustech.com   Ready    master,worker   17h   v1.22.0-rc.0+a44d0f0
master-1.kni20.schmaustech.com   Ready    master,worker   17h   v1.22.0-rc.0+a44d0f0
master-2.kni20.schmaustech.com   Ready    master,worker   17h   v1.22.0-rc.0+a44d0f0
worker-4.kni20.schmaustech.com   Ready    worker          58s   v1.22.0-rc.0+a44d0f0

Hopefully this provides a good example of how to use VmWare virtual machines to simulate baremetal nodes for OpenShift IPI deployments.

Thursday, January 06, 2022

BareMetal IPI OpenShift Lab on VmWare?


I see a lot of customers asking about being able to deploy an OpenShift Baremetal IPI lab or proof of concepts in VmWare.  Many want to do it to try out the deployment method without having to invest in the physical hardware.   The problem faced with VmWare is the lack of an Intelligent Platform Management Interface (IPMI) for the virtual machines.   I am not knocking VmWare either in this case because they do offer a robust API via Vcenter that lets one do quite a bit via scripting for automation.  However the OpenShift Baremetal IPI install process requires IPMI or RedFish which are standards on server hardware.  There does exist though a project that can possibly fill this gap though but it should only be used for labs and proof of concepts not production.

The project that solves this issue is called virtualbmc-for-vsphere.  If the name virtualbmc sounds familiar its because that project was originally designed to provide IPMI to KVM virtual machines.  However this forked version of virtualbmc-for-vsphere uses the same concepts to provide an IPMI interface for VmWare virtual machines.  Only the code knows how to talk to Vcenter to power on/of and set bootdevices  of the virtual machines.  Here are some example of what IPMI commands are supported:

# Power the virtual machine on, off, graceful off, reset, and NMI. Note that NMI is currently experimental
ipmitool -I lanplus -U admin -P password -H 192.168.0.1 -p 6230 power on|off|soft|reset|diag

# Check the power status
ipmitool -I lanplus -U admin -P password -H 192.168.0.1 -p 6230 power status

# Set the boot device to network, disk or cdrom
ipmitool -I lanplus -U admin -P password -H 192.168.0.1 -p 6230 chassis bootdev pxe|disk|cdrom

# Get the current boot device
ipmitool -I lanplus -U admin -P password -H 192.168.0.1 -p 6230 chassis bootparam get 5

# Get the channel info. Note that its output is always a dummy, not actual information.
ipmitool -I lanplus -U admin -P password -H 192.168.0.1 -p 6230 channel info

# Get the network info. Note that its output is always a dummy, not actual information.
ipmitool -I lanplus -U admin -P password -H 192.168.0.1 -p 6230 lan print 1

From the commands above it looks like we get all the bits that are required from an IPMI standpoint when doing a OpenShift BareMetal IPI deployment.  

Before I proceed to show how to setup virtualbmc-for-vsphere lets quick look at our test virtual machine within Vcenter (vcenter.schmaustech.com).   From the picture below we can see that there is a virtual machine called rheltest which is currently powered on and has an ipaddress of 192.168.0.226.  Once we get virtualbmc-for-vsphere configured we will use IPMI commands to power down the host and then power it back up.


Now that we have familiarized ourself with the VmWare environment lets take a moment to setup virtualbmc-for-vsphere.   There are one of two methods for installation: using pip (more information can be found here) and running via a container.   In this discussion I will be using the container method since that is more portable for me and easier to stand up and remove from my lab environment.  The first thing we need to do is pull the image:

# podman pull ghcr.io/kurokobo/vbmc4vsphere:0.0.4
Trying to pull ghcr.io/kurokobo/vbmc4vsphere:0.0.4...
Getting image source signatures
Copying blob 7a5d07f2fd13 done  
Copying blob 25a245937421 done  
Copying blob 2606867e5cc9 done  
Copying blob 385bb58d08e6 done  
Copying blob ab14b629693d done  
Copying blob bf5952930446 done  
Copying config 789cdc97ba done  
Writing manifest to image destination
Storing signatures
789cdc97ba7461f673cc7ffc8395339f38869abb679ebd0703c2837f493062db

With the image pulled we need to start the container with the following syntax below.  I should note that the -p option can be specified more then once using different port numbers.  Each of the port numbers will then in turn be used for a virtual machine running in VmWare.

# podman run -d --name vbmc4vsphere -p "6801:6801/udp" -v vbmc-volume:/vbmc/.vbmc ghcr.io/kurokobo/vbmc4vsphere:0.0.4
ddf82bfdb7899e9232462ae3e8ea821d327b0db1bc8501c3827644aad9830736
# podman ps
CONTAINER ID  IMAGE                                 COMMAND               CREATED        STATUS            PORTS                   NAMES
ddf82bfdb789  ghcr.io/kurokobo/vbmc4vsphere:0.0.4   --foreground          3 seconds ago  Up 3 seconds ago  0.0.0.0:6801->6801/udp  vbmc4vsphere

Now that the vbmc4vsphere container is running lets go ahead and get a bash shell within the container:

# podman exec -it vbmc4vsphere /bin/bash
root@ddf82bfdb789:/# 

Inside the container we will go ahead and use the vbmc command to add our rheltest virtual machine.  For this command to work we need to specify the port that will be listening (should be one of the ports specified with the -p option at container run time), a IPMI username and password, the vcenter username and password and the vcenter hostname or ipaddress:

root@ddf82bfdb789:/# vbmc add rheltest --port 6801 --username admin --password password --viserver 192.168.0.30 --viserver-password vcenterpassword --viserver-username administrator@vsphere.local
root@ddf82bfdb789:/# vbmc list
+----------+--------+---------+------+
| VM name  | Status | Address | Port |
+----------+--------+---------+------+
| rheltest | down   | ::      | 6801 |
+----------+--------+---------+------+
root@ddf82bfdb789:/# 

Once the entry is created we need to start it so its listening for incoming IPMI requests:

root@ddf82bfdb789:/# vbmc start rheltest
root@ddf82bfdb789:/# vbmc list
+----------+---------+---------+------+
| VM name  | Status  | Address | Port |
+----------+---------+---------+------+
| rheltest | running | ::      | 6801 |
+----------+---------+---------+------+
root@ddf82bfdb789:/# exit
exit
#

Now lets grab the ipaddress off the host where the virtualbmc-for-vsphere container is running.   We need this value when we specify the host in our IPMI command:

# ip addr show dev ens3
2: ens3: <ltBROADCAST,MULTICAST,UP,LOWER_UP>gt mtu 1500 qdisc fq_codel state UP group default qlen 1000
    link/ether 52:54:00:b9:97:58 brd ff:ff:ff:ff:ff:ff
    inet 192.168.0.10/24 brd 192.168.0.255 scope global noprefixroute ens3
       valid_lft forever preferred_lft forever
    inet6 fe80::6baa:4a96:db6b:88ee/64 scope link noprefixroute 
       valid_lft forever preferred_lft forever

Now let test if we can see the power status of our rheltest host with ipmitool.  We know in our previous screenshot that it was on.  I will also run a ping to show the host is up and reachable.

# ipmitool -I lanplus -U admin -P password -H 192.168.0.10 -p 6801 power status
Chassis Power is on

# ping 192.168.0.226 -c 4
PING 192.168.0.226 (192.168.0.226) 56(84) bytes of data.
64 bytes from 192.168.0.226: icmp_seq=1 ttl=64 time=0.753 ms
64 bytes from 192.168.0.226: icmp_seq=2 ttl=64 time=0.736 ms
64 bytes from 192.168.0.226: icmp_seq=3 ttl=64 time=0.651 ms
64 bytes from 192.168.0.226: icmp_seq=4 ttl=64 time=0.849 ms

--- 192.168.0.226 ping statistics ---
4 packets transmitted, 4 received, 0% packet loss, time 3109ms
rtt min/avg/max/mdev = 0.651/0.747/0.849/0.072 ms


So we confirmed the host is up so lets go ahead and power it off:

# ipmitool -I lanplus -U admin -P password -H 192.168.0.10 -p 6801 power off
Chassis Power Control: Down/Off

Now lets check with ipmitool and see if the status is also marked as off and if it responds to a ping:

# ipmitool -I lanplus -U admin -P password -H 192.168.0.10 -p 6801 power status
Chassis Power is off

# ping 192.168.0.226 -c 4 -t 10
PING 192.168.0.226 (192.168.0.226) 56(84) bytes of data.
From 192.168.0.10 icmp_seq=1 Destination Host Unreachable
From 192.168.0.10 icmp_seq=2 Destination Host Unreachable
From 192.168.0.10 icmp_seq=3 Destination Host Unreachable
From 192.168.0.10 icmp_seq=4 Destination Host Unreachable

--- 192.168.0.226 ping statistics ---
4 packets transmitted, 0 received, +4 errors, 100% packet loss, time 3099ms
pipe 4

Looks like the host is off and no longer responding which is what we expected.  From the Vcenter console we can see rheltest has also been powered off.   I should note that since we are using the VmWare API's under the covers in virtualbmc-for-vsphere the shutdown task also got recorded in Vcenter under recent tasks.


Lets go ahead and power rheltest back on with the ipmitool command:

# ipmitool -I lanplus -U admin -P password -H 192.168.0.10 -p 6801 power on
Chassis Power Control: Up/On

We can again use ipmitool to validate the power status and ping to validate the connectivity:

# ipmitool -I lanplus -U admin -P password -H 192.168.0.10 -p 6801 power status
Chassis Power is on

# ping 192.168.0.226 -c 4
PING 192.168.0.226 (192.168.0.226) 56(84) bytes of data.
64 bytes from 192.168.0.226: icmp_seq=1 ttl=64 time=0.860 ms
64 bytes from 192.168.0.226: icmp_seq=2 ttl=64 time=1.53 ms
64 bytes from 192.168.0.226: icmp_seq=3 ttl=64 time=0.743 ms
64 bytes from 192.168.0.226: icmp_seq=4 ttl=64 time=0.776 ms

--- 192.168.0.226 ping statistics ---
4 packets transmitted, 4 received, 0% packet loss, time 3066ms
rtt min/avg/max/mdev = 0.743/0.976/1.528/0.323 ms

Looks like rheltest is back up again and reachable. The Vcenter console also shows that rheltest has been powered on again:


Now that we understand how virtualbmc-for-vsphere works it would be rather easy to configure an OpenShift BareMetal IPI lab inside of VmWare.   While I will not go into the details here there are additional blogs I have written around the requirements for doing a baremetal IPI deployment and those should be no different in this scenario now that we have the IPMI requirement met in VmWare.

Tuesday, January 04, 2022

Using VMware for OpenShift BM IPI Provisioning


Anyone who has looked at the installation requirements for an OpenShift Baremetal IPI installation knows that a provisioning node is required for the deployment process.   This node could potentially be another physical server or a virtual machine, either way though it needs to be a node running Red Hat Enterprise Linux 8.   The most common example is where a customer would just use one of their clusters physical nodes, install RHEL 8 on it, deploy OpenShift and then reincorporate that node into the newly built cluster as a worker.   I myself have personally used a provisioning node that is virtualized on kvm/libvirt with RHEL 8 host.  In this example the deployment process, specifically the bootstrap virtual machine, is then nested.   With that said though I am seeing a lot of requests from customers that want to leverage a virtual machine in VMware to handle the provisioning duties, especially since after the provisioning process, there really is not a need to keep that node around. 

While it is entirely possible to use a VMware virtual machine as the provisioning node there are some specific things that need to be configured to ensure that the nested bootstrap virtual machine can launch properly and obtain the correct networking to function and deploy the OpenShift cluster.  The following attempts to highlight those requirements without providing a step by step installation guide since I have written about the OpenShift BM IPI process many times before.

First lets quickly take a look at the architecture of the provisioning virtual machine on VMware.  The following figure show a simple ESXi 7.x host (Intel NUC) with a single interface into it that has multiple trunked vlans from a Cisco 3750.

From the Cisco 3750 we can see the switch port is configured to allow the trunking of the two vlans we will need to be present on the provisioning virtual machine running on the ESXi hypervisor host.   The first vlan is vlan 40 which is the provisioning network used for PXE booting the cluster nodes.  Note that this vlan needs to also be our native vlan because PXE does not know about vlan tags.   The second vlan is vlan 10 which provides access for the baremetal network and for this one it can be tagged as such.  Other vlans are trunked to these ports but they are not needed for this particular configuration and are only there for flexibility when I create virtual machines for other lab testing.

!
interface GigabitEthernet1/0/6
 switchport trunk encapsulation dot1q
 switchport trunk native vlan 40
 switchport trunk allowed vlan 10,20,30,40,50
 switchport mode trunk
 spanning-tree portfast trunk
!

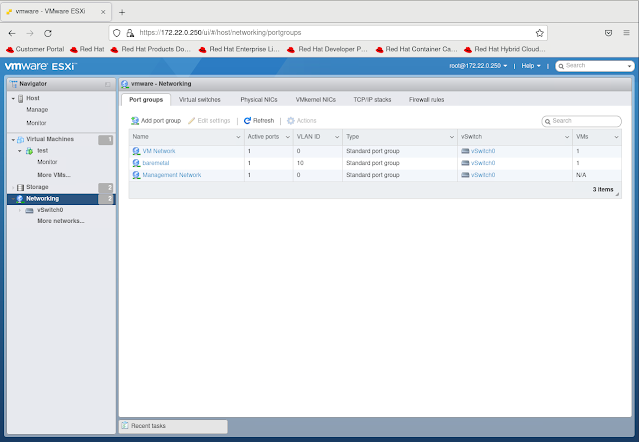
Now lets login to the VMware console and look at our networks from the ESXi point of view.   Below we can see that I have three networks: VM Network, baremetal and Management Network.   The VM Network is my provisioning network or native vlan 0 in the diagram above and provides the PXE boot network required for BM IPI deployment when using PXE.  Its also the network that gives me access to this ESXi host.   The baremetal network is the vlan 10 network and will provide the baremetal access for the bootstrap VM when it runs nested in my provisioning node.


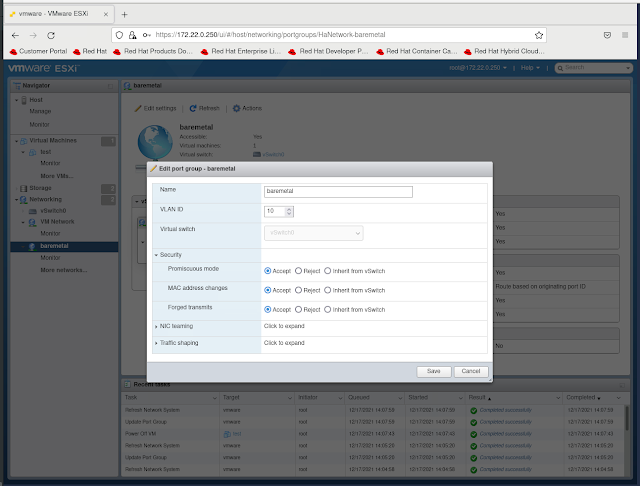
If we look at the baremetal network for example we can see that the security policies for promiscuous mode, forged transmits and MAC changes are all set to yes.   By default VMware has these set to no but they need to be enabled like I have in order for the bootstrap VM that will be run nested on our virtual provisioning node to get a baremetal ipaddress from DHCP.


To change this setting I just needed to edit the port group and select the accept radio buttons for those three options and then save it:


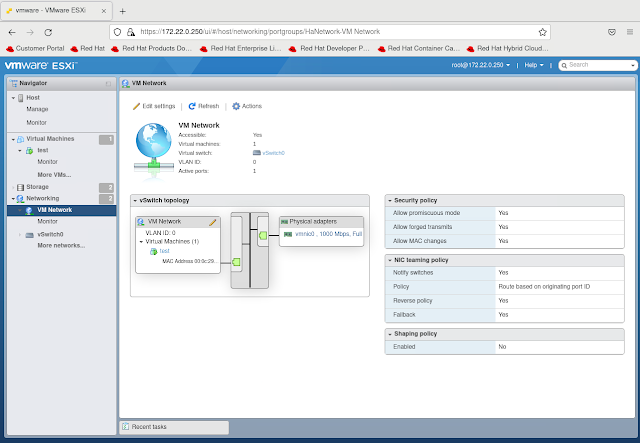
After the baremetal network has been configured correctly I went ahead and made the same changes to the VM Network which again is my provisioning network:


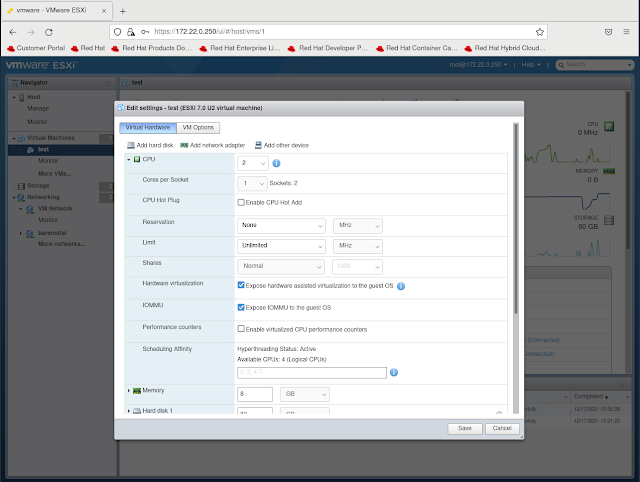
Now that I have made the required network configurations I can go ahead and create my provisioning node virtual machine in VMware.   However we need to make sure that the VM is created to pass the hardware virtualization through to the VM.  Doing so ensure we will be able to launch a bootstrap VM nested inside the provisioning node when we go to do the baremetal IPI deployment.   Below is a screenshot where that configuration setting needs to be made.  The fields for Hardware Virtualization and IOMMU need to be checked:


With the hardware virtualization enabled we can go ahead and install Red Hat Enterprise Linux 8 on the virtual machine just like we would for the baremetal IPI deployment requirements.

Once we have RHEL 8 installed we can further validate that the virtual machine in VMware is configured appropriately for us to run a nested VM inside by executing the following command:

$ virt-host-validate 
  QEMU: Checking for hardware virtualization                                 : PASS
  QEMU: Checking if device /dev/kvm exists                                   : PASS
  QEMU: Checking if device /dev/kvm is accessible                            : PASS
  QEMU: Checking if device /dev/vhost-net exists                             : PASS
  QEMU: Checking if device /dev/net/tun exists                               : PASS
  QEMU: Checking for cgroup 'cpu' controller support                         : PASS
  QEMU: Checking for cgroup 'cpuacct' controller support                     : PASS
  QEMU: Checking for cgroup 'cpuset' controller support                      : PASS
  QEMU: Checking for cgroup 'memory' controller support                      : PASS
  QEMU: Checking for cgroup 'devices' controller support                     : PASS
  QEMU: Checking for cgroup 'blkio' controller support                       : PASS
  QEMU: Checking for device assignment IOMMU support                         : WARN (No ACPI DMAR table found, IOMMU either disabled in BIOS or not supported by this hardware platform)
  QEMU: Checking for secure guest support                                    : WARN (Unknown if this platform has Secure Guest support)

If everything passing (the last two warning are okay) then one is ready to continue to do a baremetal IPI deployment using the virtual machine as a provisioning node in VMware.

Friday, December 31, 2021

Alternate Appliance Troubleshooting


Normally I would not document about an appliance problem.  After all I have replaced quite a few components across a wide array of appliances including a stop clutch in a Whirlpool washing machine.  However this latest experience was one that I felt needed better documentation given that the symptoms can sometimes be confused with those of other components and one might replace those first which can lead to a lot of extra cost without results.  Before we dive into the symptoms and fix though, lets introduce the appliance in question.  In my case it was a Whirlpool Gold Series Dishwasher (WDF750SAYM3) however the following will most likely apply to any Whirlpool dishwasher.

The problem started a few months ago with a undissolved soap packet after a completed cycle.  I didn't think much of it and carried on.  However then on another cycle I never heard the water spraying inside the dishwasher.   The washer would fill and drain but never engage the spraying of the water to actually wash the dishes.   At this point I was starting to wonder what was going on so I did a little research and found how to do a diagnostic run cycle on the dishwasher.  This involved by pressing any 3 (three) keys in the 1-2-3-1-2-3-1-2-3 sequence except Start, Delay,  or Cancel  and making sure the delay between key presses is not more than 1 sec.  If a problem is found, the dishwasher may display an error code by flashing the clean button in two sequences.  The first sequence will flash the clean led multiple times and then pause and the second sequence will flash clean led multiple times.  By counting the flashes in both sequences I would get a two digit error code.  However upon running the diagnostics I only got a code showing the water was too cold which makes sense because the run from my hot water heater is quite far and unless I run the hot water at the sink the initial water will be cool. With the diagnostics not showing any issues I started to try to find an answer online.  Most of the information found though seemed to point to a bad spray pump or a controller board issue.   I did not think it was either of these those because on some days the dishwasher worked normally without any problems but then on other days it seemed more problematic.  That was when I stumbled across a post where it was indicated that on this particular model of Whirlpool dishwasher there was a bad latch design and the latch mechanism had no test in diagnostic mode.  I thought I might be onto something so I replaced the latch with a new redesigned part.  The dishwasher seemed to be working.

The success however was short lived and if anything I was seeing the pattern of failures starting to become more prevalent.  In observing the dishwasher I found that a run would fail if during the first fill the spraying action did not start before the water shutoff.  So I would hit Cancel and Start again and sometimes it would eventually work.   I also found that if the water was hot on the start the chances of a successful wash went up.  Again when the dishwasher would work it was just fine so I still was ruling out it was a spray pump issue or controller board issue.  If either were truly bad I would expect my dishes to come out dirty and when the dishwasher worked they were clean.

Again I went back to researching on the internet and came across a conversation about the turbidity sensor (sometimes referred to as OWI) in Whirlpool dishwashers.  So what does this sensor do?  As the soil level increases, the amount of transmitted light decreases. The turbidity sensor measures the amount of transmitted light to determine the turbidity of the wash water. These turbidity measurements are supplied to the dishwasher controller board, which makes decisions on how long to wash in all the cycles.  However this is only part of the story because this sensor also has a thermistor built into it as well which monitors water temperature.  The temperature monitoring is key because as I stated earlier my dishwasher seemed to have better success when the water was very hot coming into the dishwasher.

With my new found information I proceeded to test my turbidity sensor.  With the power supply to the dishwasher turned off, the turbidity sensor can be tested from the main controller board at the connection P12 from the wire at pin 1 to the wire at pin 3. The resistance should measure between 46KO to 52KO at room temperature.  My resistance however was not in specification so I knew I found the source of my problem.

I went ahead and ordered my replacement sensor and when it arrived I used the following video to guide me through replacing the sensor:


Once the sensor was replaced I needed to run another diagnostic since that is what Whirlpool recommends when replacing the turbidity sensor.  Once that was complete I tested out the dishwasher over the course of a few days running multiple loads per day.   Every cycle was successful so I could finally declare success.   I should note however that when I was replacing the sensor I noticed my water supply line was corroded and slightly leaking but I will save that story for another day.


Friday, December 17, 2021

ETCD: Where is my Memory?


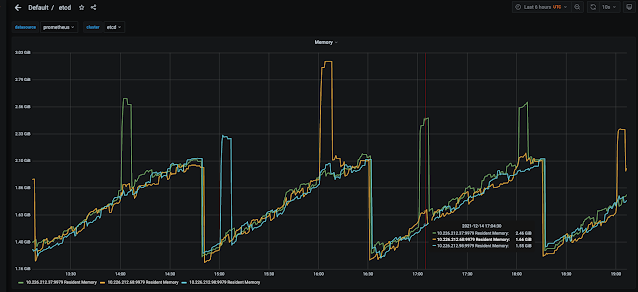
A colleague recently approached me about some cyclical etcd memory usage on their OpenShift clusters.  The pattern appeared to be a “sawtooth” or “run and jump” pattern when looking at the etcd memory utilization graphs.  The pattern happened every two hours where over the course of the two hours memory usage would gradually increase and then roughly at the two hour mark would abruptly drop back down to a more baseline level before repeating.  My colleague wanted to understand why this behavior was occurring and what was causing the memory to be freed.  In order to answer this question we first need to explore a little more about etcd and what things impact memory utilization and allow for free pages to be returned.


Etcd  can be summarized as a distributed key-value data store in OpenShift designed to be highly available and strongly consistent for distributed systems. OpenShift uses etcd to store all of its persistent cluster data, such as configs and metadata, allowing OpenShift services to remain scalable and stateless.

Etcd’s datastore is built on top of a fork of BoltDB called BBoltDB. Bolt is a key-value store that writes its data into a single memory mapped file which enables the underlying operating system to handle how data is cached and how much of the file remains in memory.   The underlying data structure for Bolt is B+ tree consisting of 4kb pages that are allocated as they are needed.  It should be noted that Bolt is very good with sequential writes but weak with random writes.  This will make more sense further in this discussion.


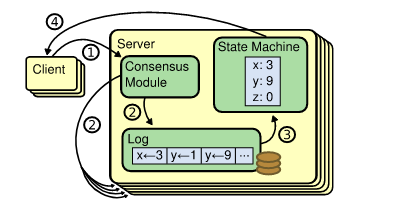
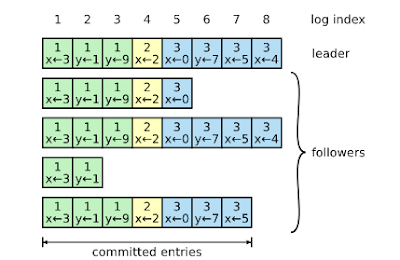
Along with Bolt in etcd is a protocol called Raft which is a consensus algorithm that is designed to be easy to understand and provide a way to distribute a state machine across a cluster of distributed systems.  Consensus, which involves a simple majority of servers agreeing on values, can be thought of as a highly available replication log between the nodes running etcd in the OpenShift cluster.  Raft works by electing a leader and then forcing all write requests to go to the leader.  Changes are then replicated from the leader to the other nodes in the etcd cluster.  If by chance the leader node goes offline due to maintenance or failure Raft will hold another election for a leader.


Etcds uses multiversion concurrency control (MVCC) in order to handle concurrent operations from different clients.  This ties into the Raft protocol as each version in MVCC relates to an index in the Raft log.  Etcd manages changes by revisions and thus every transaction made to etcd is a new revision.  By keeping a history of revisions, etcd is able to provide the version history for specific keys.  These keys are then in turn associated with their revision numbers along with their new values.  It's this key writing scheme that enabled etcd to make all writes sequential which reduces reliability on Bolts weakness above at random writes.

As we discussed above, etcd use of revisions and key history enables useful features for a key or set of keys.  However, etcds revisions can grow very large on a cluster and consume a lot of memory and disk.  Even if a large number of keys are deleted from the etcd cluster the space will continue to grow since the prior history for those keys will still exist.   This is where the concept of compaction comes into play.   Compaction in etcd will drop all previous revisions smaller than the revision being compacted to.   These compactions are just deletions in Bolt but they do remove keys from memory which will free up memory.   However if those keys have also been written to disk the disk will not be freed up until a defrag which can reclaim the space.

Circling back to my colleague's problem, I initially thought maybe a compaction job every two hours was the cause of his “sawtooth” graph of memory usage.  However it was confirmed that his compaction job was configured to run every 5 minutes.  This obviously did not correlate to the behavior we were seeing in the graphs.

Then I recalled, besides storing configs and metadata, etcd also stores events from the cluster.  These events would be stored just like we described above in key value pairs and would have revisions.  Although events would most likely never have new revisions because each event would be a unique key value pair.  Now every cluster event has an event-ttl assigned to it.  The event-ttl is just like one would imagine, a time to live before the event is removed or aged out.  The thought was maybe we had a persisting grouping of events happening that would age out over the time frame pattern we were seeing in the memory usage.  However upon investigating further we found the event-ttl was set to three hours.  Given our pattern was at a two hour scenario we abandoned looking any further at that option.

Then as I was looking through documentation about etcd I recalled that Raft with all of its responsibilities in etcd also does a form of compaction.  If we recall from above I indicated Raft has a log which contains indexes which just happens to be memory resident.   In etcd there is a configuration option called snapshot-count which controls the number of applied Raft entries to hold in memory before compaction executes.  In versions of etcd before v.3.2 that count was 10k but in v3.2 or greater the value has been set to 100k so ten times the amount of entries.  When the snapshot count on the leader server is reached the snapshot data is persisted to disk and then the old log is truncated.  If a slow follower requests logs before a compacted index is complete the leader will send a snapshot for the follower to just overwrite its state.   This was exactly the explanation for the behavior we were seeing.

Hopefully this walk through provided some details on how etcd works and how memory is impacted on a running cluster.  To read further on any of the topics feel free to explore these links:

Thursday, December 02, 2021

The Lowdown on Downward API in OpenShift


A customer approached me recently with a use case where they needed to have the OpenShift container know the hostname of the node it was running on.  They had found that the normal hostname file on Red Hat CoreOS was not on the node so they were not certain how they could derive the hostname value when they launched the custom daemonset they built.  Enter the downward API in OpenShift.

The downward API is a implementation that allows containers to consume information about API objects without integrating via the OpenShift API. Such information includes items like the pod’s name, namespace, and resource values. Containers can consume information from the downward API using environment variables or a volume file.

Lets go ahead and demonstrate the capabilities of the downward API with a simple example of how it can be used.  First lets create the following downward-secret.yaml file which will be used in our demonstration.  The secret file is just a basic secret nothing exciting:

$ cat << EOF > downward-secret.yaml
apiVersion: v1
kind: Secret
metadata:
  name: downwardsecret
data:
  password: cGFzc3dvcmQ=
  username: ZGV2ZWxvcGVy
type: kubernetes.io/basic-auth
EOF

Now lets create the secret on the OpenShift cluster:

$ oc create -f downward-secret.yaml
secret/downwardsecret created

Next lets create the following downward-pod.yaml file:

$ cat << EOF > downward-pod.yaml
apiVersion: v1
kind: Pod
metadata:
  name: downward-pod
spec:
  containers:
    - name: busybox-container
      image: k8s.gcr.io/busybox
      command: [ "sh", "-c"]
      args:
      - while true; do
          echo -en '\n';
          printenv NODENAME HOSTIP SERVICEACCT NAMESPACE;
          printenv DOWNWARD_SECRET;
          sleep 10;
        done;
      resources:
        requests:
          memory: "32Mi"
          cpu: "125m"
        limits:
          memory: "64Mi"
          cpu: "250m"
      volumeMounts:
        - name: downwardinfo
          mountPath: /etc/downwardinfo
          readOnly: false
          
      env:
        - name: NODENAME
          valueFrom:
            fieldRef:
              fieldPath: spec.nodeName
        - name: HOSTIP
          valueFrom:
            fieldRef:
              fieldPath: status.hostIP
        - name: SERVICEACCT
          valueFrom:
            fieldRef:
              fieldPath: spec.serviceAccountName
        - name: NAMESPACE
          valueFrom:
            fieldRef:
              fieldPath: metadata.namespace
        - name: DOWNWARD_SECRET
          valueFrom:
            secretKeyRef:
              name: downwardsecret
              key: username
  volumes:
    - name: downwardinfo
      downwardAPI:
        items:
          - path: "cpu_limit"
            resourceFieldRef:
              containerName: busybox-container
              resource: limits.cpu
          - path: "cpu_request"
            resourceFieldRef:
              containerName: busybox-container
              resource: requests.cpu
          - path: "mem_limit"
            resourceFieldRef:
              containerName: busybox-container
              resource: limits.memory
          - path: "mem_request"
            resourceFieldRef:
              containerName: busybox-container
              resource: requests.memory
EOF

Lets quickly take a look at the contents of that file which will create a pod called downward-pod and inside run a container called busybox-container using the busybox image:

$ cat downward-pod.yaml 
apiVersion: v1
kind: Pod
metadata:
  name: downward-pod
spec:
  containers:
    - name: busybox-container
      image: k8s.gcr.io/busybox
      command: [ "sh", "-c"]
      args:
      - while true; do
          echo -en '\n';
          printenv NODENAME HOSTIP SERVICEACCT NAMESPACE;
          printenv DOWNWARD_SECRET;
          sleep 10;
        done;
      resources:
        requests:
          memory: "32Mi"
          cpu: "125m"
        limits:
          memory: "64Mi"
          cpu: "250m"
      volumeMounts:
        - name: downwardinfo
          mountPath: /etc/downwardinfo
          readOnly: false
          
      env:
        - name: NODENAME
          valueFrom:
            fieldRef:
              fieldPath: spec.nodeName
        - name: HOSTIP
          valueFrom:
            fieldRef:
              fieldPath: status.hostIP
        - name: SERVICEACCT
          valueFrom:
            fieldRef:
              fieldPath: spec.serviceAccountName
        - name: NAMESPACE
          valueFrom:
            fieldRef:
              fieldPath: metadata.namespace
        - name: DOWNWARD_SECRET
          valueFrom:
            secretKeyRef:
              name: downwardsecret
              key: username
  volumes:
    - name: downwardinfo
      downwardAPI:
        items:
          - path: "cpu_limit"
            resourceFieldRef:
              containerName: busybox-container
              resource: limits.cpu
          - path: "cpu_request"
            resourceFieldRef:
              containerName: busybox-container
              resource: requests.cpu
          - path: "mem_limit"
            resourceFieldRef:
              containerName: busybox-container
              resource: limits.memory
          - path: "mem_request"
            resourceFieldRef:
              containerName: busybox-container
              resource: requests.memory


Under the container section we also defined some resources and added a volume mount. The volume mount will be used to mount up our downward api volume files which will consist of the resources we defined.  Those files will get mounted under the path /etc/downwardinfo inside the container:

      resources:
        requests:
          memory: "32Mi"
          cpu: "125m"
        limits:
          memory: "64Mi"
          cpu: "250m"
      volumeMounts:
        - name: downwardinfo
          mountPath: /etc/downwardinfo
          readOnly: false

Next there is a section where we defined some environment variables that reference some additional downward API values.  There is also a variable that references the downwardsecret.  All of these variables will get passed into the container to be consumed by whatever processes require them:

        env:
        - name: NODENAME
          valueFrom:
            fieldRef:
              fieldPath: spec.nodeName
        - name: HOSTIP
          valueFrom:
            fieldRef:
              fieldPath: status.hostIP
        - name: SERVICEACCT
          valueFrom:
            fieldRef:
              fieldPath: spec.serviceAccountName
        - name: NAMESPACE
          valueFrom:
            fieldRef:
              fieldPath: metadata.namespace
        - name: DOWNWARD_SECRET
          valueFrom:
            secretKeyRef:
              name: downwardsecret
              key: username

And finally there is a volumes section which defines the filename and the resource value field for the downwardinfo files that we want to pass into the container:

  volumes:
    - name: downwardinfo
      downwardAPI:
        items:
          - path: "cpu_limit"
            resourceFieldRef:
              containerName: busybox-container
              resource: limits.cpu
          - path: "cpu_request"
            resourceFieldRef:
              containerName: busybox-container
              resource: requests.cpu
          - path: "mem_limit"
            resourceFieldRef:
              containerName: busybox-container
              resource: limits.memory
          - path: "mem_request"
            resourceFieldRef:
              containerName: busybox-container
              resource: requests.memory


Now that we have an idea of what the downward-pod.yaml does lets go ahead and run the pod:

$ oc create -f downward-pod.yaml 
pod/downward-pod created
$ oc get pod
NAME           READY   STATUS    RESTARTS   AGE
downward-pod   1/1     Running   0          6s

With the pod running we can now validate that the downward API variables and volume files we set.  First lets just look at the pod log and see if the variables we defined and printed in our argument loop show the right values:

$ oc logs downward-pod

master-0.kni20.schmaustech.com
192.168.0.210
default
default
developer

master-0.kni20.schmaustech.com
192.168.0.210
default
default
developer


The variables look to be populated correctly with the right hostname, host IP address, namespace and serviceaccount.   Even the username for our secret is showing up correctly as developer.   Since that looks correct lets move on and execute a shell in the pod:

$ oc exec -it downward-pod sh
kubectl exec [POD] [COMMAND] is DEPRECATED and will be removed in a future version. Use kubectl exec [POD] -- [COMMAND] instead.
/ # 

Once inside lets print the environment out and see if our variables are listed there as well:

/ # printenv
KUBERNETES_PORT=tcp://172.30.0.1:443
KUBERNETES_SERVICE_PORT=443
HOSTNAME=downward-pod
SHLVL=1
HOME=/root
TERM=xterm
KUBERNETES_PORT_443_TCP_ADDR=172.30.0.1
PATH=/usr/local/sbin:/usr/local/bin:/usr/sbin:/usr/bin:/sbin:/bin
KUBERNETES_PORT_443_TCP_PORT=443
KUBERNETES_PORT_443_TCP_PROTO=tcp
HOSTIP=192.168.0.210
DOWNWARD_SECRET=developer
NAMESPACE=default
KUBERNETES_PORT_443_TCP=tcp://172.30.0.1:443
KUBERNETES_SERVICE_PORT_HTTPS=443
PWD=/
KUBERNETES_SERVICE_HOST=172.30.0.1
SERVICEACCT=default
NSS_SDB_USE_CACHE=no
NODENAME=master-0.kni20.schmaustech.com

Again the environment variables we defined are showing up and could be consumed by a process within the container. 

Now lets explore our volume files and confirm they too were set.   We can see the /etc/downwardinfo directory and four files exist:

/ # ls /etc/downwardinfo
cpu_limit    cpu_request  mem_limit    mem_request

Lets look at the contents of the four files:

/ # echo "$(cat /etc/downwardinfo/cpu_limit)"
1
/ # echo "$(cat /etc/downwardinfo/cpu_request)"
1
/ # echo "$(cat /etc/downwardinfo/mem_limit)"
67108864
/ # echo "$(cat /etc/downwardinfo/mem_request)"
33554432


The values in the files look correct and correspond to the resource values we defined in the downward-pod.yaml file that launched this pod.

At this point we have validated that the downward API does indeed provide information into the pod and can present itself either as an environment variable for a volume file.  So if anyone every asks how to get the hostname of the node the pod is running on as an environment variable inside the pod just keep the downward API in mind.